Processing GC-MS data
GC-MS chromatograms
GC-MS chromatograms are stored as a ANDI-MS/netCDF file wich contains the measurement parameters and all mass spectra from wich the chromatogram is constructed.
A GC-MS dataset in opened by simply dragging and dropping the data file into Mnova.
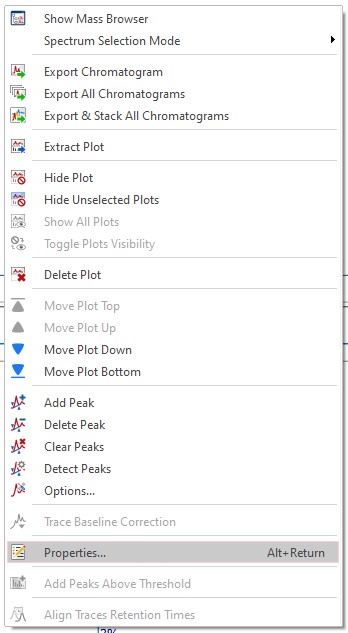
The first time you open a GCMS data file you have to set the display properties. Right click in the spectral window and select 'Properties'
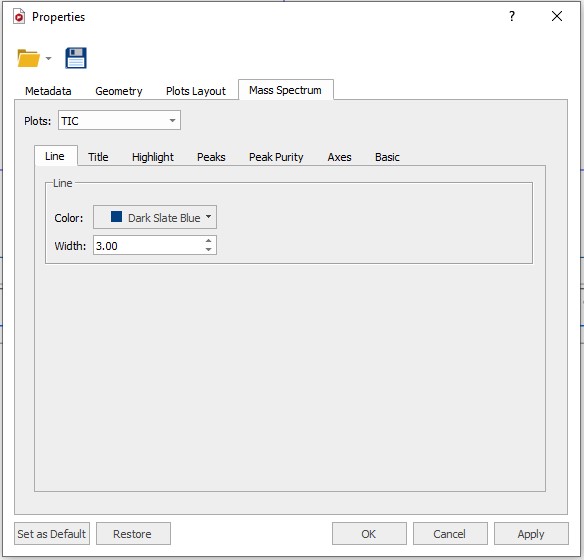
Download the GC-MS chromatogram properties file located here and load in into MestreNova using the 'Folder' symbol at the top of the 'Properties' Window. After loading the file click the 'Apply' and 'Set as Default' buttons at the bottom of the 'Properties' window followed by 'OK'.
Data view
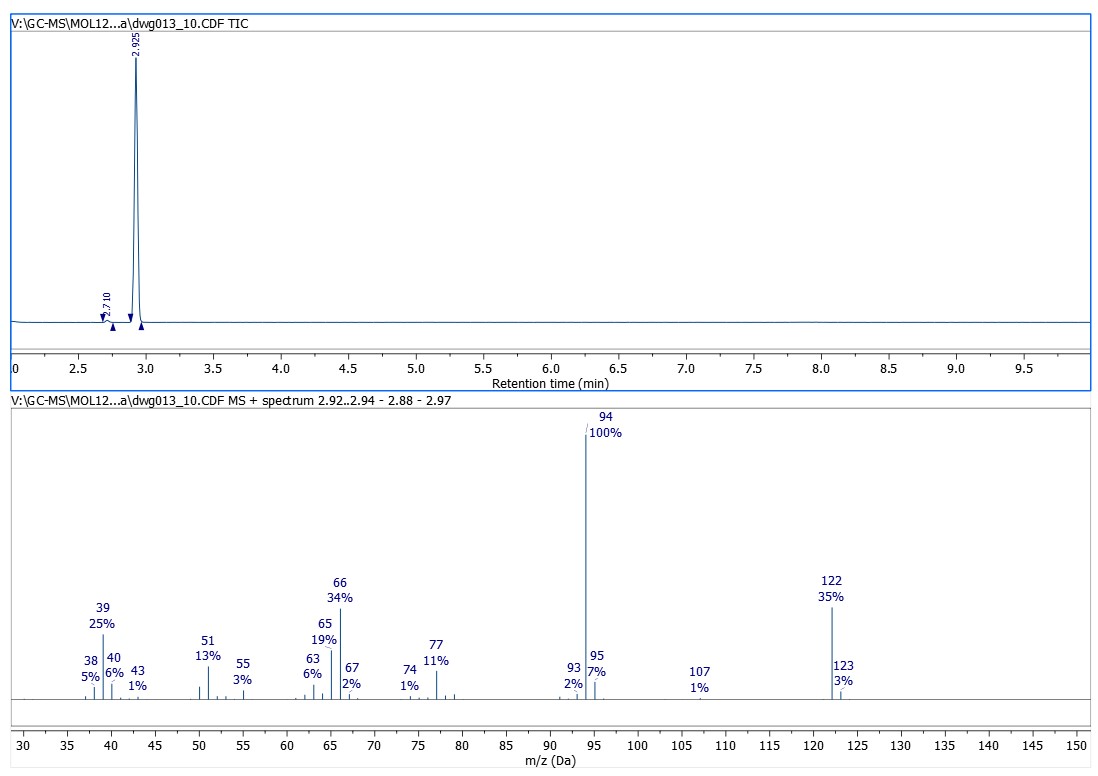
After opening the data file Mnova diplays the chromatogram (TIC) on the top half of the window and the MS spectrum of the highest peak is shown in the lower half.
Zoom in/out
While processing and interpreting your chromatogram and spectrum it is sometimes neccesary to zoom in to specific regions or peaks. All magnification functions can be found in the 'View'ribbon
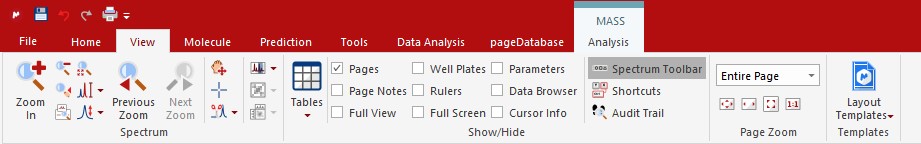
The zoom functions can also be accessed via keyboard short-cuts; 'Zoom In' (z), 'Zoom Out' (shift + z), 'Full Spectrum'(f). Besides the short-cuts, the 'Spectrum Toolbar' from the 'View' ribbon also adds the most used magnification buttons to the right hand side of the screen for easy access. In order to zoom in the vertial direction simply use the scroll wheel of your mouse.
Mass spectrum selection
The mass spectrum of a of single scan of the chromatogram can be selected using the 'Crosshair/Select' tool from the MASS Analysis ribbon and clicking in the chromatogram.
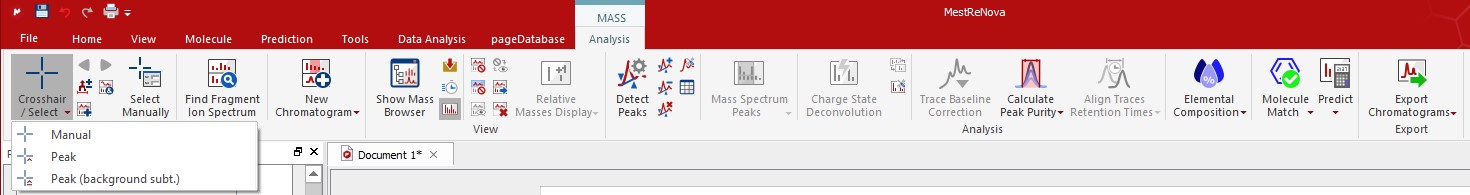
To Average the mass spectra over a certain time range (CoAdd), use the crosshair, hold down the left mouse button and drag over the appropriate time span in the chromatogram. A label at the top of the MS will inform you about the range of the retention time. If you want to ‘CoAdd’ the whole peak, just select the mode ‘Peak’ under the ‘Crosshair/Select’ tool from the 'MASS Analysis' ribbon and then click on the desired peak in the Chromatogram. To generate a ‘CoAdd’ of the whole peak with background subtracted, just select the mode ‘Peak (Background Subt.)’ under the ‘Crosshair/Select’ tool from the 'MASS Analysis' ribbon, and click on the desired peak. Off-course peaks need to be defined for the last two options to work.
To Add an extra mass spectrum to your layout select the 'Append' button next to the ‘Crosshair/Select’ tool from the 'MASS Analysis' ribbon, and click on the desired peak in the chromatogram. To move a chromatogram or mass spectrum to a new page, right click and select 'Extract Plot'.
Chromatografic Peaks
After opening a data file MNova automatically performs a peak detection in the chromatogram. The left and right borders of a peak are marked with vertical wedge symbols. To add or delete peaks from the chromatogram the corresponding buttons in the peaks section of the 'MASS Analysis' ribbon.

Peak information such as retention time and area% can be found in the 'Peaks Table' which accesseble from the peaks section of the 'MASS Analysis' ribbon.