Theory
As you know, the electromagnetic (EM) spectrum is divided in different regions that can be distinguished by the effects that radiation from each region has on molecules and atoms. Whilst the different regions are broadly recognized, they do not have sharply defined boundaries. Thus, the boundaries in the figure above are a bit arbitrary.
Roughly, we speak of infrared radiation when the wavelength of the radiation is between 1 mm and 750 nm, corresponding to frequencies of 300 GHz and 400 THz, respectively. The infrared region is commonly subdivided further into three parts (again with arbitrary borders) referred to as near, mid and far infrared, for their distances to the visible part of the EM spectrum:
- near infrared (λ = 750 nm to λ = 2500 nm)
- mid infrared (λ = 2.5 μm to λ = 15 μm)
- far infrared (λ = 15 μm to λ = 1 mm)
Although all three types of infrared radiation have applications in spectroscopy, IR spectroscopy in the chemical lab focuses specifically on the mid infrared. Radiation from this region affects the internal vibrations of molecules.
The x-axis of an IR spectrum is typically annotated with wavenumbers (1/λ) in units of cm-1 ('reciprocal centimeters') rather than with frequencies or wavelengths. A wavenumber of 4000 cm-1 corresponds to a wavelength of 2.5 μm (since you can fit four thousand waves with a length of 2.5 μm per centimeter) and a wavelength of 15 μm corresponds to a wavenumber of 666.67 cm-1.
Typically, peaks in the higher wavenumber region of the mid infrared correspond to vibrations of two atoms linked by a single chemical bond. For that reason, this region is known, colloquially as the (functional) 'group frequency region'. Vibrations with frequencies in the lower half of the mid infrared are mostly vibrations of the complete molecule. Thus, these vibrations (and the resulting pattern of peaks in an IR spectrum) are very characteristic for individual molecules. This half of the IR spectrum is therefore known as the 'fingerprint region'.
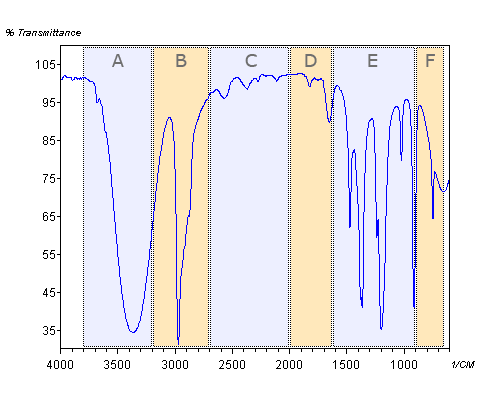
In this module, the spectral range of typical IR spectra is subdivided in six areas (A to F) that have no official meaning whatsoever but will help you in recognizing the different peaks. The regions will be studied separately. Quizzes per area help you to practice and repeat the recognition of the particular peaks (and the corresponding molecular functional groups).
The six areas are:
|
 |
Although, for obvious reasons, you will practice the recognition of peaks that are present in a certain Area, it is important to realize that the absence of peaks is equally or perhaps even more important than their presence. The absence of a particular peak is conclusive evidence for the absence of a particular functional group, whereas a peak that shows up in a certain Area leaves room for interpretation. Often, you can only be certain of the presence of certain functional groups in a molecule if you find corroborative evidence via the presence of absence of one or more other peaks in other Areas. The presence of a certain peak is called positive evidence; its absence is negative evidence.


